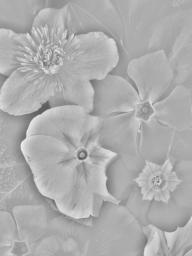


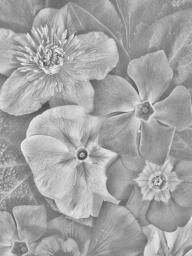
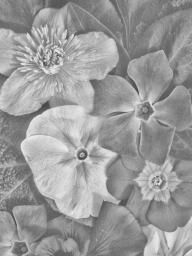


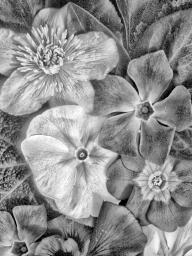


These images have been clipped to 384x512 and in this version are stored at half this resolution. A larger version of this array is available.
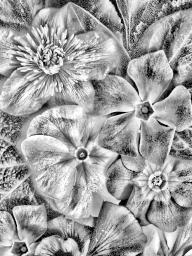
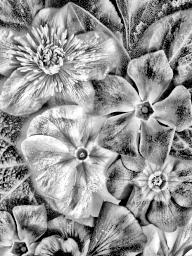
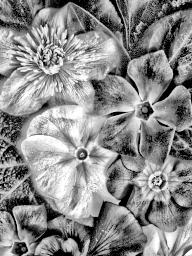
(Click on any image for enlarged version.)This is an array of different enhancement processes. Each image was created with a different cumulation function power (alpha) and proportion of local-mean replacement (beta). The top-right image is the original image, equivalent to using alpha=beta=1. The top-left image, local-mean subtraction, was generated with alpha=1, beta=0. The bottom-left image is fully equalized (alpha=beta=0).
One value of alpha was used for each row: 0, 0.25, 0.5, 0.75 and 1 from bottom to top. One value of beta was used for each column: the same sequence from left to right.
The Fourier series method was used with a 41x41 window and 30 terms in each case. Out-of-range values were clipped; these occur most often in images below the bottom-left to top-right diagonal.